The sooner you start saving, the better...
"Compound interest is the eighth wonder of the world", Warren Buffett.
Compound interest retained earnings reflects an initial capital that pays an interest. The main difference with the simple interest is that, in the case of compound interest, profits are added to the capital invested and this can increase profits exponentially.
Imagine you invest $ 10.000 to 10% a year. Every year you get a return of $ 1,000. If you take away those gains in 30 years there will be earned $ 30,000. Simple, right?
Now imagine you do not take away that $ 1,000 each year, but reinvest them at the same 10% a year. The first year you will pay $ 1.000, so your investment will be $ 11.000. But the second year you will pay $ 1.100, with an investment of $ 12.100 (11.000 + 1.100) capital. After the third year you will get $ 1.210, and so on.
Do you know how much you win with compound interest over the same period? The sum of $ 164.494!
In the following table we have done the same exercise with an initial investment of just $ 2,000, considering NO CONTRIBUTIONS, different yields and different time horizons.
Additional profit of our strategy, for each ending year, is the difference of columns (4) - (2) and (5) - (3), for both scenarios:
| Ending Year | 1.37% (1) | 7.25% (2) | 14.40% (3) | 15.63% (4) | 17.39% (5) |
|---|---|---|---|---|---|
| 10 | $ 2,291.52 | $ 4,027.20 | $ 7,678.74 | $ 8,545.46 | $ 9,938.96 |
| 20 | $ 2,625.54 | $ 8,109.16 | $ 29,481.56 | $ 36,512.41 | $ 49,391.48 |
| 30 | $ 3,008.25 | $ 16,328.60 | $ 113,190.70 | $ 156,007.60 | $ 245,450.02 |
| 40 | $ 3,446.73 | $ 32,879.26 | $ 434,581.24 | $ 666,578.07 | $ 1,219,759.19 |
| 50 | $ 3,949.14 | $ 66,205.65 | $ 1,668,519.24 | $ 2,848,106.85 | $ 6,061,570.03 |
| 60 | $ 4,524.77 | $ 133,311.63 | $ 6,406,066.80 | $ 12,169,186.14 | $ 30,122,856.50 |
- (1) Real on 1-3 Year Treasury Bond Fund ETF (SHY)
- (2) Real on Core S&P500 ETF (IVV)
- (3) Real on Core S&P500 ETF (IVV), excluding subprime crisis year 2008
- (4) Simulated 7 year backtesting with Nielsoft Finance Dual Investment Strategy (trading in IVV & SHY)
- (5) Simulated 6 year backtesting with Nielsoft Finance Dual Investment Strategy, excluding subprime crisis year 2008
Don't you think this is the best gift for the newborn?
Our Performance in Chile
Since 2002, we applied our dual investment strategy moving between the most risky fund (Type A) and most conservative fund (Type E).
Based on our decision making models, we have not only doubled the result of the most profitable fund in the last 12 years, but we have also avoided major crises.
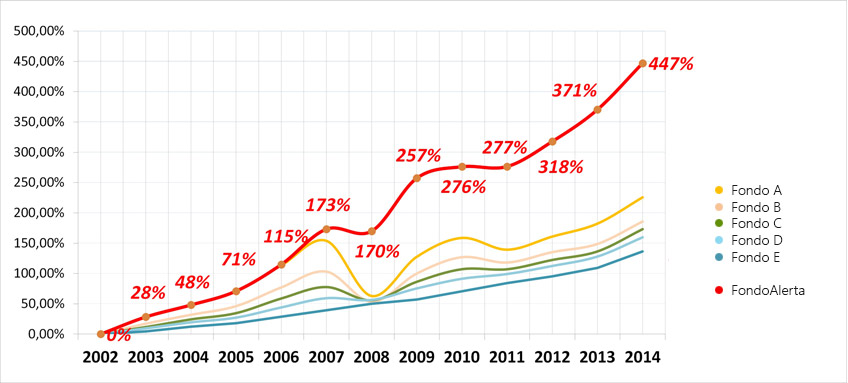
Real return plotted from 2002 to 2014
Our backtesting performance for last 7 years with S&P500 / Treasury Bonds
First we started in 2015 with our strategy to invest specifically in CORE S&P500 ETF (IVV) / Treasury Bonds 1-3 years ETF (SHY). Simulated backtesting of our models, considering seven years between 2008 and 2014, gave us the following results:
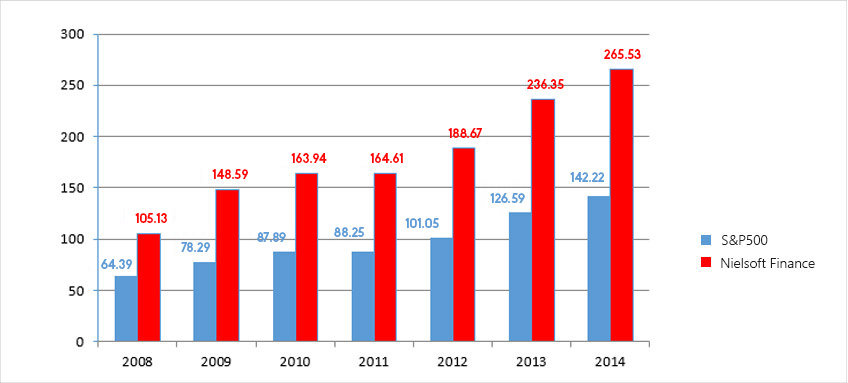
The S&P500 index rented an annual average of 7.25%, the Treasury Bonds an average of 1.37%, and our strategy rented an annual average of 15.63%; It is 1.87 times the yield figure of S&P500. All this with a minimum amount of trading: 1.29 average transactions per year.